Pollution
Fossil fuels – Acid Rain
What is acid rain?
- Acid rain is the popular name for a variety of processes which all involve deposition of acidic materials in the form of rain, snow, dry particles such as soot and gases. It is more correctly termed acid deposition.
- Rainwater before the industrial Revolution had a pH range between 6 to 7.6 The rain that falls on central Europe today is a lot more acidic with an average of ph 4.1.
- The pH scale is logarithmic so that rain of Ph 4 is 100 times more acidic than rain of pH6.
- 0 = maximum acidity
7 = neutral point in the middle of the scale
14 = maximum alkalinity (the opposite of acidity)
Sources of acid rain.
Sulphur and nitrogen from the oxidization of fossil fuels mainly contribute to acid rain.
|
 Move your mouse
over the pH levels to
find items of this
acidity/alkalinity.
|
- Burning of fossil fuels
S + O2 forms SO2 N + O2 forms NO2
- This further oxidizes in the clouds
SO2 + O2 forms SO42- NO2 + O2 forms NO3-
- These reactions are catalysed by ozone, ammonia, and by unburnt hydrocarbons. These then go into solution.
SO42- + 2H+ forms H2SO4 (sulphuric acid)
NO3- + H+ forms HNO3 (nitric acid)
These two make up ACID rain.
Effects of acid rain.
Acid rain has a number of effects that include the corrosion and subsequent erosion of buildings and statues made from limestone but the most important are the environmental problems caused when it falls on forests, lakes and rivers and soil.
Forests
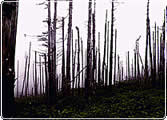 The leaching effect of acid rain removes Ca2+ and Mg2+ from the soil which then results in the poor development of the layer that binds cells together in plant tissue (middle lamella) and chlorophyll for photosynthesis. Plants also take up more aluminium ions (Al3+) which can be toxic. In addition to this, atmospheric SO2 and NO2 damage the photosynthetic spongy and palisade mesophyll cells of the leaves. All this leads to poor growth and death of trees. Trees suffering in this way are also stressed and less tolerant to frost and fungal infections.
 More information
Lakes and rivers
SO42- displaces Al3+ from the soil. These aluminium ions wash into water and interfere with the gill function of fish. A sticky mucus accumulates and limits the uptake of oxygen which can result in the death of the fish. Changes in pH also cause the exoskeletons of invertebrates such as crustacea to become soft.
 More information
Soil
In soil, acid rain dissolves and washes away nutrients needed by plants. It also dissolves out toxic substances, such as aluminium. These toxins can then pollute water or poison plants that absorb them. Alkaline soils can neutralize acid deposition but others, especially thin mountain soils derived from granite, cannot.
What can society do to prevent acid rain?
The  US EPA (Environment Protection Agency) has a detailed list on their website
Follow these links to the EPA website to find out more about:
……………………………………………………………………………………
What Society Can Do About Acid Deposition
There are several ways to reduce acid deposition, more properly called acid deposition, ranging from societal changes to individual action.
……………………………………………………………………………………

1. Using  this website, describe the effects of acid rain on humans.
Use a poster to present your findings.
 2. Indicator species for atmospheric pollutants.
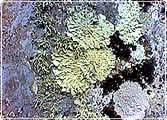
Lichens are sensitive plants that can be used as biological indicators of atmospheric pollution. Visit the  Natural History Museum web pages to find out how they are used. (Photo - Scilly Isles lichen)
3. What is happening in the UK?
The following figures are taken from the ‘defra’ website (Click here for the source web page)
Thousand tonnes |
|---|
| 1970 | 1980 | 1990 | 1995 | 2000 | 2001 | 2002 |
|---|
Large combustion plants | 3,626 | 3,430 | 2,929 | 1,756 | 899 | 822 | 745 |
Other sources | 2,829 | 1,423 | 792 | 608 | 290 | 293 | 257 |
Total emissions | 6,455 | 4,852 | 3,721 | 2,363 | 1,189 | 1,115 | 1,002 |
Plot these figures on a graph and describe what is happening.
A detailed answer is given  here:
here:
 Oil spills


What's your opinion?
Average rating


Not yet rated